Most prop firm challenges are decided by risk per trade
18 October 2026 · 6 min read · St. Joseph Desk
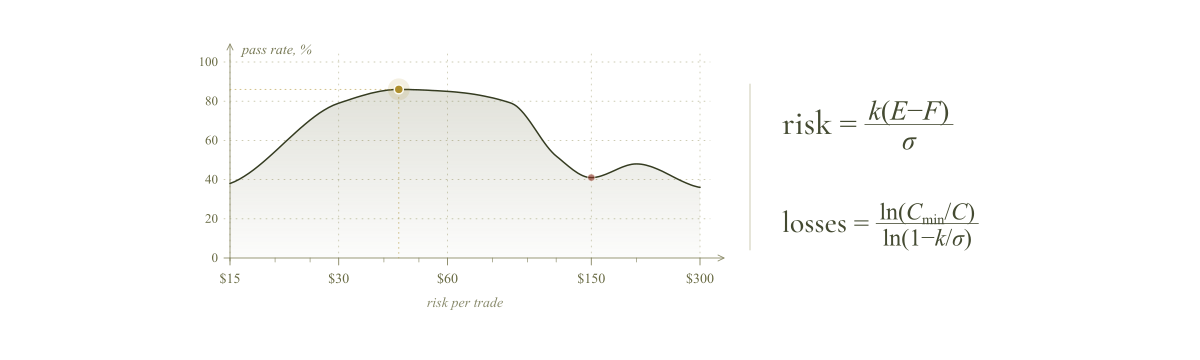
Most traders who fail a prop firm challenge look at their entries first. They change the setup, the timeframe, the indicator. Often the entries were fine. The size of each trade is what ended the account.
We ran a simulation to see how much risk per trade matters when everything else stays the same. The answer is a lot more than most people expect.
What the simulation shows
We used the Risk Sim engine with 4,000 simulated challenges per row, 60 trading days each, and a fixed dollar risk on every trade.
The account is a $6,000 one-phase challenge. The profit target is 8%, the max loss is 10% and the daily loss limit is 5%.
The trader wins 45% of trades at 1.5 reward-to-risk and takes 3 trades a day. That is a small real edge: +0.125R per trade on average. It is a plain, believable trader. Nothing here is a star performer.
Only the risk per trade changes from row to row.
| Risk per trade | % of account | Pass | Blown | Still running at day 60 | Median days to pass |
|---|---|---|---|---|---|
| $15 | 0.25% | 38% | 0% | 62% | 44 |
| $30 | 0.50% | 79% | 3% | 19% | 27 |
| $44 | 0.73% | 86% | 7% | 6% | 17 |
| $60 | 1.00% | 85% | 14% | 1% | 11 |
| $90 | 1.50% | 79% | 21% | 0% | 6 |
| $120 | 2.00% | 52% | 48% | 0% | 2 |
| $150 | 2.50% | 41% | 59% | 0% | 2 |
| $200 | 3.33% | 48% | 52% | 0% | 2 |
| $300 | 5.00% | 36% | 64% | 0% | 1 |
The same trader with the same edge passes 86% of the time at $44 a trade and 41% of the time at $150. Nothing about the strategy changed between those two rows.
Why too big fails
A 45% win rate means losing 55% of trades. Losses arrive in runs. With a 10% max loss on a $6,000 account, the room is $600. At $150 a trade, four losses in a row use all of it. At $44, it takes about thirteen.
The daily limit is tighter still. It is 5%, or $300. At $150 a trade, two losing trades in one day bring you to the line. Three trades a day makes that likely to happen at some point in a few weeks.
Look at the blown column. It climbs from 3% at $30 to 59% at $150. Past about 1.5% of the account, most of the failed runs are blown accounts, not slow ones.
The $200 row passes more often than the $150 row. That is simulation noise and the luck of a few big streaks, not a real effect. Do not read it as a sign that bigger is safer. The trend across the whole table is what counts, and it points one way.
Why too small also fails
The $15 row has almost no blown accounts. It also passes only 38% of the time. Of the 4,000 runs, 62% were still running after 60 days.
The edge is real but small. At 0.25% risk per trade the account grows too slowly to reach 8% in the time available. The median pass takes 44 days, and many runs never get there.
Time is a cost. A challenge with a clock rewards the size that earns enough before the clock ends and still survives the bad weeks.
Between the two failures there is a band where the odds are best. In this test it runs from roughly 0.5% to 1.5% of the account, with the peak near 0.73%. Median time to pass in that band falls from 27 days to 6.
How to find your size
The best size depends on your own win rate and reward-to-risk. A trader with a 60% win rate at 1:1 has a different curve from the one above. So the useful step is to run your numbers, not to copy ours.
- Put your real win rate, reward-to-risk and trades per day into the challenge calculator, along with the target, max loss and daily limit from your firm.
- Look at pass, blown and still-running together. A size with a high pass rate and a high blown rate is a coin flip with extra steps.
- Choose a size inside the best band, then check that the blown share is one you can live with.
- Turn the dollar amount into lots with the position size calculator, using your actual stop distance.
Size also changes with the market. When volatility is above normal, stops are wider or the same stop is hit more often, so the same dollar risk deserves a smaller position. That is what the "size today" card in the morning letter is for. It tells you how to scale before the session starts.
Limits of this test
This is a simulation of the inputs we gave it. It is not a prediction of what will happen to your account.
- A real win rate moves around. A trader who wins 45% over a year may win 35% in a bad month.
- Real daily-loss rules can trigger on open losses, not only on closed trades. A trade that dips far below your stop before recovering can still end your day.
- Two-step challenges should be run phase by phase in the calculator, since each phase has its own target and its own risk.
- One edge, one rule set. Change the inputs and the table changes.
For context on how hard challenges are in practice: Topstep's own 2025 disclosure reported that 16.8% of Trading Combines started were completed, counted per attempt. Most firms publish no pass rates at all, so there is little else to compare against.
The short version
Size is the one input you control completely, and it moves the pass rate more than most entry tweaks could. Too large ends the account early. Too small runs out the clock. The good range is narrower than it feels, and it depends on your numbers.
Run yours in the prop firm challenge calculator before your next attempt, and get the daily sizing note in the free morning letter.
Not financial advice · general commentary, the same for every reader · simulated results, not a prediction.
Tomorrow's levels and size, before the open.
No signals, no upsell. One-click unsubscribe. Privacy